Originally posted by NYniner85:
I wonder what the correlation between INT % and winning % is?
Good question,...and good thing is people have the data posted out there somewhere. Here are a couple quick cases to outline the mistake of people confusing correlation and causation.
1st is a stat that includes all teams for
NFL 2014-2018 Seasons....

Has turnovers instead of INTs, but you clearly see the linkage some stuff has while others simply do not an of course. Some things like scoring defense obviously had more points allowed sorted toward the top, and the negative means losing.
Look @ how low yards per carry were. Would probably surprise many,...but it's pretty evident that it's now a passing league with the way the rules are and if your running game is good, capitalize on it with the pass or you are doomed to be disappointed.
Here is an SI.com stat that went back as far as 1970 when it comes to
INTs in the playoffs as they relate to wins...
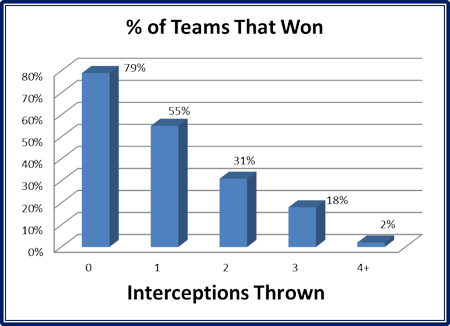
Makes sense,....but it also highlights the
correlation causation fallacy people fall into. The 3rd down preachers here going by the same correlation data are saying "SIMPLE Solution: Don't pass the ball in the playoffs!!
Run it all game and you will win 80% of the time!!"
Lol they obviously don't realize it, but this is what they are saying whenever they try to predict how good a player
now is via a team's
past 3rd down %. It's essentially forcing square peg down a round hole, as it's clearly not an independent (predictive) stat,...which is the 2nd calculation that needs to be done is the one that's alot more relevant than past percentages.
 Paying Jimmy $26M just to watch him get hurt again is stupid business. Paying Jimmy $26M knowing you're gonna start someone else at some point this year is stupid business...players take pay cuts all the time. Jimmy shouldn't be any different...$12M is still a s**t ton of money (12th overall at his position which is high end proper value for him). He get's to be a FA, compete to start on a SB roster, and he wouldn't find that type of cash on the open market right now. period.


