Rodgers now sits atop the league based on last season's stats.
First, correcting three mistakes:
(1) Smh I typed that 0.3226*0.1 =~0.003. It's actually about 0.03. This is unforgivable, but it happened. Fortunately, it doesn't change things THAT much. For example, Josh Allen's passing stat metric goes from 0.28172136222 to 0.39306501548. It less than doubles it. The specific calculations are (0.003*2664+5*36-.4*15)/646 vs (0.03*2664+5*36-.4*15)/646.
(2) I treated touchdowns and interceptions on equal footing in terms of their numerical weight, because both are on the same order of magnitude usually (in the two digits). However, I didn't account for the fact that touchdowns are thrown about 2.1 times as often as INTs, which means I need to increase the importance of INTs by double, which changes that value from 0.4 (rounded down) to 0.9 (0.43*2 = 0.86 ~= 0.9).
(3) I was making an additional mistake with CAY that I didn't catch until just now. The issue, I found out, is that I was counting CAY too many times. See, I wanted to weight OnTgt passing and 1D% with CAY to account for the fact that deep passes are harder than short passes. But that was a very rough and imprecise way to do that. Someone who may have a high CAY might just be extremely accurate deep, and horribly accurate short, for example, but the few accurate deep balls would outweigh the many inaccurate short ones. Not to mention, reducing On Target Passing in this way short-changes the way QBs help with YAC, by throwing in-stride. So, instead of counting CAY two more additional times than in the first passing section, I will simply let OnTgt% and 1D% stand on their own, and trust that including CAY as a raw number instead of yards is sufficient to account for that.
Another change: I decided it was kind of bush league to make the contributions to rush output only useful for mobile QBs. However, since I'm already stretching the win% correlation by making that decision initially to include rushing and make it useful, what I will do is split the difference and give everyone the same coefficient for rushing output. That is, instead of a piecewise function, everyone will get the average of the respective coefficients in the piecewise function. So, instead of 0.001 for non-mobile QBs and 0.03 for mobile ones, it's (0.001+0.03)/2 = 0.16 (rounded). (this, of course, bumps Jimmy up a bit)
I made two other changes: I feel like 4th quarter comebacks and blowout wins are more dependent on team output than my formula suggests. However, I think 4QC are more dependent on the QB than blowouts are. So, both are reduced, but in different amounts. 4QCs are reduced to a fourth of their previous value, and BOWs are reduced to an 8th. Unfortunately, this knocks Jimmy down a bit, but I can't just ignore team contributions for the outcome of games.
Lastly, I had to again adjust the final number's translation and scaling to get the numbers close to what the previous iterations were, in terms of maximum and minimum. So, 25 + 150*(stuff) becomes 40 + 150.
Anyway, with these changes, the formula becomes:

This makes last year's QBs rank thusly:

Of note: this pulls Wilson from the absurdly low ranking he had in previous iterations, and it bumps Wentz up, knocking Jimmy down to 14. But you can see he's only 0.002 behind Murray here.
------------------------------------------------------------------------------------------------------------------------------------------------------------------
MODIFICATIONS OF THIS FORMULA 5-13-2022:
I've added a few things to reduce the leaking of team contributions into this metric.
Passing changes: (1) 1D% is now weighted by CAY/ATT. (2) I've added On Target Passing, but have also weighted that by CAY/ATT, to make sure WR contributions are minimized.
Rushing changes: (1) Replaced rushing yards with rushing yards after contact and broken tackles. (2) Added Rushing First Downs, which do have a positive correlation with winning.
In addition, the scaling and translation numbers were changed to 25 and 150 to keep the same number of guys in the 100s.
The updated formula is: (deleted)
Jimmy jumps up to 11th with these changes, but drops in rating. Trey Lance drops to 101.891 (would put him 7th). A few guys switch places, but it's pretty steady. Winston would have scored a 104.078, which makes sense based on the eye test of watching him last year—haters gonna hate (although he probably would have dropped a bit with more games). (deleted)
__________________________________________________________________________________________________________________
ORIGINAL POST:
I've been trying to think of a good way to rank QBs for a while now, and have been working on this almost a couple weeks. But first:
tl;dr version:
Jimmy finished 12th in the NFL, with a rating of 94.646. At least half of the people here think he's closer to 15 or worse. Others think he's top 10. It's interesting he ranks higher here. People in NFL commentary circles like to say Jimmy "just wins," and I think I have better insight as to why this is true than I did before. Yeah, teammates and coaching play a role, but while he sucks at a lot of things, he's good at one thing that really matters with respect to winning (1D%), and what he sucks the most at doesn't really affect winning that much. Read on to know why. (And also, for the curious, Trey's rating was quite high at 104.819, which would have put him between Herbert and Allen. Of course, he gave a tiny sample size, and in all likelihood he would have dropped had he played more.)
Also, why bother even reading this? Well, here's why:
https://www.nfl.com/news/next-gen-stats-intro-to-passing-score-metric
According to NGS, here are the correlations with WIN% between NGS's metric, PFF's metric, and ESPN's Total QBR:
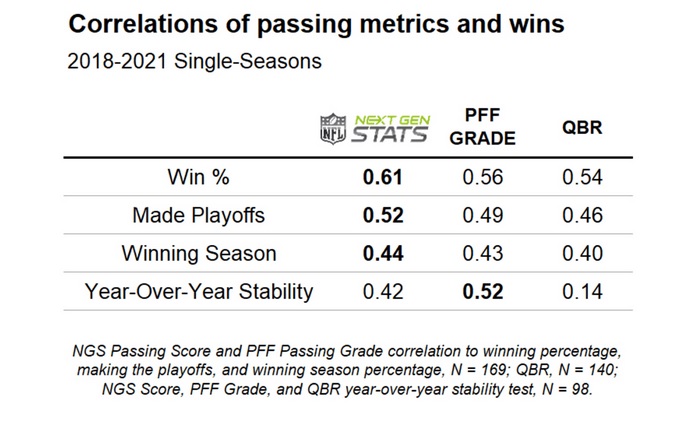
Now, I don't know precisely what correlation method they used, but usually the method is calculating the Pearson Correlation Coefficient (this and other mathy terms will be described below). Assuming those numbers are their correlation coefficients with how their metric correlates with winning, here's mine: 0.85
Now, if they're using the Spearman rho version, here's mine: 0.86
And lastly, if they are using the Coefficient of Determination instead of simply the correlation coefficient, here's what I got: 0.73
Bottom line, for at least the 31 QBs I looked at, in this one season (2021), my metric appears to correlate better with wins. One huge DISADVANTAGE of my metric is that it's likely going to vary wildly when QB statistical sample sizes are low. But I wasn't interested in one game performance. Another one is the tiny sample sizes (31 QBs, over the course of one season).
Anyway, for my metric, the single most important factor was 1D%, or first downs per pass play. For NGS, EPA appears to be their most important factor. I get why advanced stat people like it, but its coefficient of determination is barely over 0.5. One criticism of my metric is one might argue that team results are leaking into this metric a bit, and that's probably true to an extent, with at least one stat in particular, and maybe another (blowout wins, and possibly fourth quarter comebacks). But I also have a version that doesn't include those, and the metric still correlates well, at 0.80 for correlation and 0.64 for determination).
1D% obviously depends on coaching and team as well, but it's far and away the best indicator of win% for a QB. I'd be out of my mind not to use it. Ideally, I'd prefer an air yards modified version of it. But I already take air yards into account with this metric.
So yeah, I think this worked out pretty well for at least the 2021 season. If you read on, maybe you'll see why.
.
.
But first, here's the ranking of all the 31 QBs who started at least 10 games:

Anyway, that looks pretty good to me. I'm surprised about a few things. For example, I've always considered Russell Wilson elite, and I'd be far more comfortable with this ranking if Jimmy and him swapped. But the truth is, Wilson dropped the ball in clutch scenarios last year, and was 11th worst in the NFL at first downs per pass play. Wilson had better pure passing stats, but he was barely any better at rushing stats, was worse than Jimmy at sack related stats, and was worse at clutch stats, like 4QC and 1D%. One stat I didn't include was 3D% , or third down passes for first downs (I didn't include this because 1D% already covers all of the plays relevant to 3D%). Wilson ranked 19th in the NFL in that category. Jimmy was 6th. Wilson just wasn't great last year at the moments that matter, and the Seahawks' record is a testament to that.
I'm, of course, open to suggestions about how to tweak this and make it better.
.
.
————————————————————————————————————————————————
————————————————————————————————————————————————
————————————————————————————————————————————————
MOTIVATION
————————————————————————————————————————————————
————————————————————————————————————————————————
————————————————————————————————————————————————
So why do all this, you might ask? First, NFL Passer Rating doesn't take into account contributions from non-QBs, and it effectively counts completion percentage twice (because YPA is counted as well, and YPA = Yards*COMP%/COMP). Nor does it include rushing contribution, sacks, or clutch scenarios. Second, ESPN's Total QBR does include some of that (allegedly), but the formula remains hidden. NGS's metric weights EPA as its highest factor, despite EPA having around only a 50% correlation rate with winning (and, by the way, they have Tannehill ranked higher than Mahomes, Brady, and Allen, which seems ludicrous). Also, they don't take into account sacks, and they also normalize their final rating between 50 and 100, which I am not a fan of because it puts a limit on how high or low someone can score. While I understand why you might want to do that, I'd prefer a naked number. Lastly, they weight their stats with winning, like we do here. But I think they are missing an important stat or two.
So, I want to see about getting different ways to measure and compare QBs than these metrics. Regarding this metric, most important of all, I want this rating to focus on how the things a QB does relate to winning, because in the end, winning is what this is all about. So I will use some very basic statistical methods, based on stats I think are the most descriptive of the QB position. And lastly, this is just for fun, and I am lazy, so I'm not even going to attempt to worry about stability or sample size. I'm going with the 31 QBs who started ten games or more, and I'm happy with that. I'm not a group of statisticians working in concert. I'm a guy who took one statistics class in college because I was more interested in other math and science related topics. There will be corners cut here, and I don't care. All I care about is win% correlation.
So, I suspect what I give up in strict math technique (like utilizing something like the James-Stein Estimator to reduce low sample size data points from being much more variable than season long statistics), I'll make up for in common sense: that is, choosing the right stats to look at. I will utilization normalization for the purpose of comparing stats, of course, since it's necessary for finding correlation coefficients.
.
.
One additional goal I had when starting this is to hopefully gain some insights into why Jimmy is a "winner," beyond simply the fact that he has had a great supporting cast (Spoiler alert: it's his performance in moving the chains and being better than the mean in 4QC situations, and the fact that interceptions per game do not correlate with winning as much as most of us think. Obviously supporting cast matters, but that isn't explicitly taken into account here.).
————————————————————————————————————————————————
What I consider the important inputs to a QB rating:
1. Completed air yards, rather than yards, because this is a QB rating, not a WR rating.
2. Touchdown passes.
3. Rushing yards and rushing touchdowns.
4. Interceptions and fumbles (I won't be distinguishing between fumbles lost vs fumbles recovered, because that is presumably random).
5. How the QB performs in clutch or less tangible scenarios (in particular, 4th quarter comebacks and, perhaps most importantly, first downs per pass play, and how often a QB leads his team to a blowout victory—note: only 50% of that will be counted for the QB).
6. Sacks and yards lost from sacks (obviously the line plays a role in this, and so do the WRs, but QBs have the power to throw the ball away, so this will count for QBs).
Being somewhat pretentious, I'll even give this metric a name: it shall be called "Win% Quarterback Rating," because the central argument for this rating's legitimacy is that every stat will be weighted based on how they correlate with win percentage for qualifying 2021 quarterbacks, and because WQBR is easier to right than "5_Golden_Ring's QB metric."
Lastly, I reserve the right to make errors, since a lot of this data is being accumulated by hand, one step at a time. I'm not a band of statisticians working in concert. I'm a guy who took one statistics class in college because I was more interested in other math and science related topics.
.
.
.
————————————————————————————————————————————————
————————————————————————————————————————————————
————————————————————————————————————————————————
INTRODUCTION TO THE METHODOLOGY
————————————————————————————————————————————————
————————————————————————————————————————————————
————————————————————————————————————————————————
WARNING: THIS IS LONG...
If you're unconcerned about the details of the math, just scroll down to the results. Each subject will be
separated by little lines like this, to make things easier to find.
But, the general gist of how I'm going to construct this formula is this:
This will be done in four steps:
(1) Determine a weighting coefficient for each stat as it relates to WIN%. That is, the more something correlates with winning, the greater the coefficient.
(2) Determine normalizing coefficients so that stats of four digits, like Completed Air Yards, can be compared to stats of two digits, like Touchdown Passes.
(3) Multiply these two coefficients together, along with any other alterations (such as reducing weight for stats that are not statistically significant), and then rounding.
(4) Add these values together, scale and translate.
.
.
.
————————————————————————————————————————————————
General form of the Win% Quarterback Rating (WQBR)
————————————————————————————————————————————————
The first thing I'm going to do is find out how the individual stats I look at correlate with winning. These coefficients will all be between -1 and 1, because they will come from correlation formulas. Then, I'm going to "normalize" the in-put stats by multiplying each stat by its own, different coefficient (less than one) that will render all these stats the same order of magnitude. And the final rating will involve multiplying these two coefficients together (the correlation coefficient—which will really be the coefficient of determination—and the "normalization" coefficient), and then adding each resulting term. Finally, I'll scale and use a translation so that the final number is in the range we're all familiar with for quarterback ratings: somewhere between 50 and 100. But this scaling WILL NOT put any caps on the number. It will be mathematically possible to score a negative rating or one in the thousands (if you're a god QB maybe).
So, the easiest way to do this kind of formula, IMHO, is to break it down into something like this:

with A being a translation value, G a scaling value, and B,C,D E being coefficients that (1) weight these stats based on correlation with win percentage (specifically, the Coefficient of Determination) and (2) normalize them so the typical digit size of the stats are more regular, and (3), each is of suitable units to make each term unitless—this justifies being able to add each term together. This justifies being able to add each term together.
And note, for those concerned about me putting my own bias about who is the best QB into this: the ONLY weighting that will be going on here is weighting by correlation with win% and weighting to simply make the digits of the stats not render an important stat useless, or a less important stat vital* (for example, CAY is three digits on the game level and four on the season level, while touchdown passes is 1 and 2 digits on the game and season level. Should CAY count ten times as much as TDs? No! Not unless it is ten times as important to winning, which it is not—in fact, as we will see below, CAY is LESS important than TD passes to winning). The only place my own bias is going to creep in is in choosing the statistics to be examined. If you think I should be looking at something else, let me know.
*The only exceptions to this are: (1) I thought sacks shouldn't be solely on the QB, so I made QBs responsible for 25% of sacks; (2) spoiler alert: rushing yards has a very weak but negative correlation with winning, so I made a judgement call and gave high volume rushers a slight bonus, and everyone else a tiny positive value for their rush yards contribution; (3) QBs generally have to play well for a team to blow out another, but obviously that's team effort, so I gave the QB only 25% of the credit.
.
.
————————————————————————————————————————————————
How each stat will be defined and/or considered
————————————————————————————————————————————————
The stats I'm going to use:
Completed air yards (CAY)
Passing touchdowns (PTD)
Interceptions (INT)
Rushing yards (RYD)
Rushing touchdowns (RTD)
4th quarter comebacks (4QC)
Blow out wins (BOW, defined here by wins by 17+ points)
First downs per pass play (1D%)
Sacks (S)
Sack yards lost (SYL)
In the final formula, these stats will be entered in at their gross value. But for the purpose of determining how they should be weighted, I'll be looking at them on a per game basis where possible, since win percentage is games won divided by total games (I am thus making the tacit assumption that what applies on per game basis applies on a per season and per attempt basis. There will always be some sort of extrapolation in this sort of thing, unfortunately). The overwhelming majority of what follows will be determining how these stats should be weighted, and then determining how to "normalize" them, as I described in the last section.
Regarding game totals for weighting purposes: If a QB who did not start all 17 games plays part of a quarter, then he will be credited for the full quarter. E.g., if a QB plays the entire first quarter, and then one play in the second quarter, the entire second quarter will be counted, and 0.5 games will be added to his game numbers. For example, since Jimmy played a full half against the Seahawks, his total games will be 15.5, not 15, for weighting purposes. This is arbitrary, and does introduce a little bit of error, but it feels more accurate than giving Justin Fields an entire game because he played in six plays.
.
.
————————————————————————————————————————————————
Determining how each quarterback statistic should be weighted relative to the others
————————————————————————————————————————————————
Step one of making a quarterback rating metric is to determine how QB stats will be weighted. As alluded to above, the way the relative weights of each stat will be counted will be determined by how they correlate to win percentage. After the proper weighting is discovered, each stat will then be normalized by the appropriate value (such as attempts, opportunities, etc).
I will use the Pearson Correlation Coefficient to check correlation. The only concern is if I end up with a numerically unstable result (But I won't worry too much about it, besides, I'm not familiar enough with statistics to do much about it anyway). I will not worry too much about outliers or weak correlations. If something has a weak correlation, I'll give it a small coefficient (and if it's close enough to zero, I will make a judgement call on whether or not to make it positive or negative, or adjust the value).
The formula for the Pearson correlation coefficient is this:
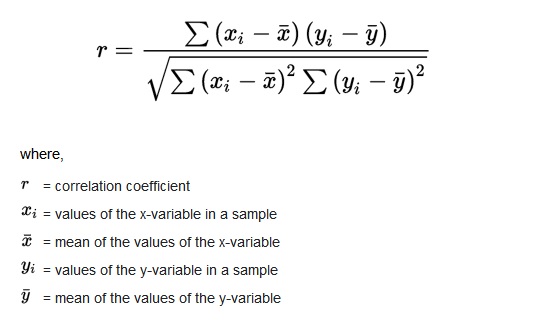
Now, the numerator is the covariance of x and the covariance of y, while the denominator is the square root of the variance of x times the variance of y. Variance is basically how much the value deviates from the expected value. Covariance is kind of like variance, except instead of these operations for x squared in the summation, or these operations for y squared, you take the one of terms of x and replace it with the terms of y. You should be able to see that in the respective summation in the numerator and the two summations in the numerator under the square root. The summation in the numerator is just what either one of the summations in the denominator would be if instead of squaring that difference, you multiplied the difference for x by the difference for y.
In any event, each correlation comparison will be with normalized data, which is standard practice. I will be using Excel to normalize my data, so I won't be posting the normalized data. I will be posting scatter plots of the normalized data, however. (Normalizing data just means basically scaling it so that comparisons can be made between things with different units. This is done using the mean and standard deviation.).
.
.
Another thing I'm going to use from this is the Coefficient of Determination. The coefficient of determination gives better information on how the two data sets match each other. In the cases of linear regression, you can get the coefficient of determination by squaring the correlation coefficient, although this can be misleading. These two things have different meanings, but I'll be using the coefficient of determination for the coefficient, not the correlation coefficient. Not only is that a bit more reliable, it's the standard practice for these kinds of so-called "advanced stats."
If you're interested on WHY you can get the coefficient of determination from the Pearson Correlation Coefficient, this math stack exchange article has a great derivation by Cm7F7Bb. Of course, I'm not going to be bothering doing any of these calculations by hand. I'll be using a calculator where I enter my two data sets and get the results I need.
In general, correlation is measured on a scale from -1 to 1. A correlation coefficient of 0 means there is exactly zero correlation between the lists of numbers. A -1 means perfect negative correlation, and 1 means perfect positive correlation. And, given that there are 31 quarterbacks, again, I will obviously not be doing these calculations by hand. Summations take a long time to do by hand, so I will be using a tool for these calculations.
So, each of our QB stats will be compared to win percentage, and those that match winning more (or losing, in the case of INTs or Fumbles) will be given a heavier weight in the final Win% Quarterback Rating calculation. And lastly, some of these statistics will either correlate weakly or not be statistically significant. That simply means, in layman's terms, that the relationship derived isn't all that reliable. But, instead of throwing, rushing yards out, for example (which oddly has a negative correlation with winning), I will use a little common sense. Rushing yards might not matter to most QBs, but to some, it's a key component of their game. So I'll find workarounds for each statistically insignificant QB stat, and in addition to weighting them half of what their correlation with winning is.
So, in summary, to find the weights for the coefficients, I will compare stats on a PER GAME basis to win percentage, because win percentage is also on a per game basis. After I find the proper coefficients, for the purposes of the WQBR formula, I will be entering the stats on a PER ATTEMPT basis, or the equivalent of that.
All that said, let's begin determining the relative weights of these statistics.
.
.
————————————————————————————————————————————————
————————————————————————————————————————————————
PASSING STATISTICS:
————————————————————————————————————————————————
————————————————————————————————————————————————
.
.
————————————————————————————————————————————————
Determining the Weight of Completed Air Yards per Game
————————————————————————————————————————————————
Here is the CAY/G data for the 31 quarterbacks who qualified (ranked alphabetically).

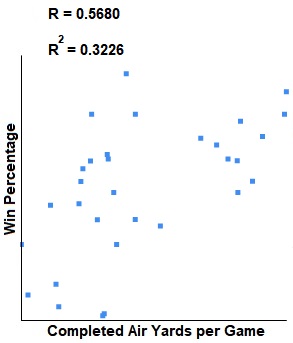
The Pearson Correlation Coefficient for this data vs win percentage, normalized, is: 0.5680. This indicates that there is a moderate positive correlation between completed air yards per game and win percentage. This relationship is statistically significant for p < 0.05.
The Coefficient of Determination is 0.3226.
Here is a scatter plot so you can see the correlation visually:
.
.
————————————————————————————————————————————————
Determining the Weight of Touchdown Passes per Game
————————————————————————————————————————————————
Here is the TD/G data for the 31 quarterbacks who qualified.

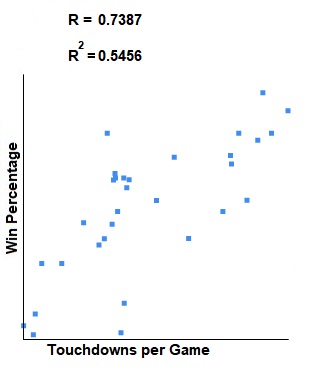
The Pearson Correlation Coefficient for this data vs win percentage, normalized, is: 0.7387. This indicates that there is a moderate positive correlation between completed air yards per game and win percentage. This relationship is statistically significant for p < 0.05.
The Coefficient of Determination is 0.5456.
Here is a scatter plot so you can see the correlation visually:
.
.
————————————————————————————————————————————————
Determining the Weight of Interceptions per Game
————————————————————————————————————————————————
Here is the INT/G data for the 31 quarterbacks who qualified.

The Pearson Correlation Coefficient for this data vs win percentage, normalized, is: -0.2907. This indicates that there is a weak negative correlation between completed air yards per game and win percentage. This relationship is not statistically significant for p < 0.05.
The Coefficient of Determination is: 0.04399.
Here is a scatter plot so you can see the correlation visually:
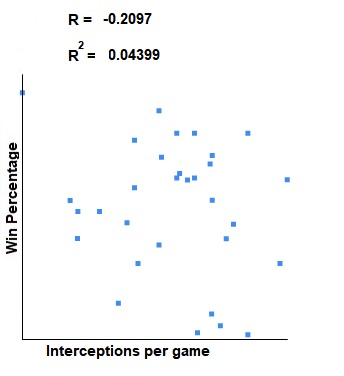
As you can see, the correlation is quite weak. The points are scattered all over the place. Now, this does make a little bit of sense, because there comes a point when if you're not throwing any interceptions at all, you're not taking enough chances to put up points. I expected a weaker correlation, and I'd be interested to see if there is an optimum interception per game number. However, that is beyond the scope of this project.
.
.
————————————————————————————————————————————————
————————————————————————————————————————————————
RUSHING STATISTICS:
————————————————————————————————————————————————
————————————————————————————————————————————————
.
.
————————————————————————————————————————————————
Determining the Weight of Rush Yards per Game
————————————————————————————————————————————————
Here is the RYD/G data for the 31 quarterbacks who qualified.

The Pearson Correlation Coefficient for this data vs win percentage, normalized, is: -0.08027 This indicates that there is a weak negative correlation between rushing yards per game and win percentage. This relationship is not statistically significant for p < 0.05.
The Coefficient of Determination is: 0.006444 (see below: I will be using TWO CoD for RYD, based on a piecewise function).
Here is a scatter plot so you can see the correlation visually:
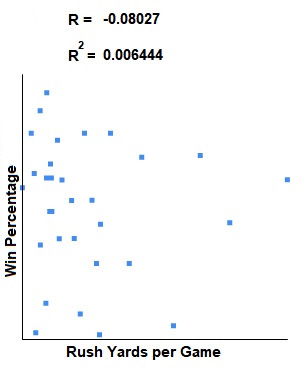
Negative? How? This was, indeed, somewhat surprising to me. But in truth, this confirms what Kyle Shanahan has said for some time: quarterbacks need to be able to win from the pocket. Many of those QBs who tend to run a lot do so because they are not great at processing or reading defenses post-snap. In other words, much of the time, running is the wrong decision. But I think the more important factor here is that the very best QBs are still pocket QBs. Even the ones who can run (like Mahomes and Allen) win from the pocket. Nevertheless, it should be noted that -0.08027 is very close to zero, meaning the correlation, negative or otherwise, is very weak.
There is, obviously, a problem here. There are instances in which a quarterback running is vital to the team (for example, Allen in the 2022 playoffs, or Kaepernick against Green Bay in his two playoff games against them). As such, something will need to be done to take into account the fact that there are a few QBs whose rushing yards are pivotal to winning.
My solution to this problem is using a piecewise function: I'll split it up for those who ran for under 15 yards per game, those who ran for between 15 and under 30 yards per game, and those who ran for 30 yards or more.
For those below 15 yards, the Coefficient of Determination is 0.06731. The correlation is NEGATIVE.
For those above 15 yards but below 30, the Coefficient of Determination is 0.06498. The correlation is NEGATIVE.
For those above 30 yards, the Coefficient of Determination is: 0.01933. The correlation is POSITIVE.
Due to the fact that even QBs who don't rush a lot can pick up key quarterback sneaks, if a QB's rushing yards are below 30 yards rushing, he will receive no penalty for rush yards. The reason this is so low is because that's the difference in the Coefficient of Determination between those two groups. I justify this not being negative because, one, the correlation is tiny and statistically insignificant, and two, what I just said about about QBs picking up key conversions on sneaks. In addition, because rushing can rarely be key to winning games, I will give this group of QBs a tiny 0.001 bonus for their rushing.
For QBs with more greater than or equal to 30 yards, they will get a much larger bonus. The value will be the distance between 0.01933 and -0.06731, which is the square root of (0.01933)^2 - (-0.06731)^2), which equals 0.08664.
In other words, I will be using the following piecewise function for rushing yards:
if x < 30, y = 0.001
if x >= 30, y = 0.08664
.
.
————————————————————————————————————————————————
Determining the Weight of Rushing Touchdowns per Game
————————————————————————————————————————————————
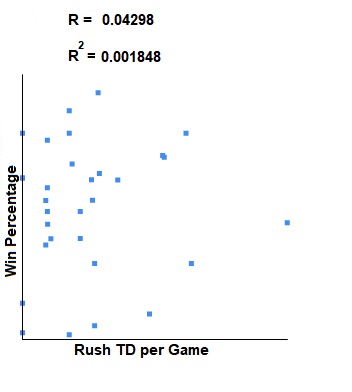
Here is the RTD/G data for the 31 quarterbacks who qualified.

The Pearson Correlation Coefficient for this data vs win percentage, normalized, is: 0.04298 .This indicates that there is a weak positive correlation between rushing touchdowns per game and win percentage. This relationship is not statistically significant for p < 0.05.
The Coefficient of Determination is: 0.001848.
Here is a scatter plot so you can see the correlation visually:
.
.
————————————————————————————————————————————————
————————————————————————————————————————————————
CLUTCH AND "INTANGIBLE" STATISTICS (4QC and First Downs per Pass Attempt):
————————————————————————————————————————————————
————————————————————————————————————————————————
First, the reasons I chose 4QC, BOW, and 1D%: For 4QC, it's because it holds a particularly important status in football culture. A QB is often measured by how well he does when the chips are all on the table. For 1D%, as you will see below, I chose this one simply because it's correlation with win% is off the charts. Also, both of these are easy to find on Pro Football Reference.
For BOW, it's because a QB may theoretically be so good that he never gets an opportunity for a 4QC, which then will penalize him for being so good. QBs contribute to blowouts just as they do to comebacks.
As for 1D%, I was contemplating adding Third Down Passes to First Downs (which is basically converting third downs with a pass), but the issue is that (a) 1D% already includes that data, and (b) it interestingly does not correlate as high as 1D% (although it definitely correlates well with winning). Another stat I was contemplating was two minute drill scoring. But for two reasons I decided against it: (1) it's correlation with wins is well below 1D%, and (2) it's exceedingly painstaking to get a hold of that statistic. You have to look at play-by-plays of every game, and well, frankly, https://www.youtube.com/watch?v=X18mUlDddCc
————————————————————————————————————————————————
Determining the 4QC per Losses rate
————————————————————————————————————————————————
This stat is the one defined by Pro Football Reference.
First, unlike the other statistics examined thus far, clutch situations will not be analyzed on a per game basis. That makes no sense, because there is a massive variance in clutch opportunities as defined by this analysis. Now, when first attempting this, I painstakingly went through each game to find when a 4QC opportunity was there, and divided 4QC by those opportunities. However, I oddly found that that relationship was not statistically significant, and the correlation was very weak (about 0.25). Not to mention, I don't want to ever have to look at every play-by-play for every QB I rate. So, instead, I opted for something that provided a more substantial correlation with winning, and which WAS statistically significant: 4QC vs losses. This relationship was about the same as CAY/G, and not only that, it's easier to get this information. So this is what I chose to use for fourth quarter scenarios.
One minor adjustment I had to make, however: if I simply choose 4QC per loss, the possibility of an infinite rating exists—namely, in the event of a perfect season with at least one 4QC. In fact, this could rear its head every single game in which there is a fourth quarter comeback on a single game basis. My solution to this is to use 4QC/(4QC+L+0.01). That way, the maximum value this can take is 0.999 (for seventeen games, all won, and all 4th quarter comebacks, 17/17.01 = 0.9994).
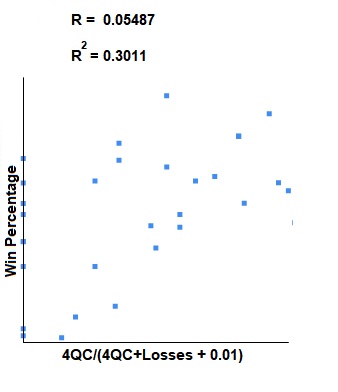
All that said, here is the 4QC/L data for the 31 quarterbacks who qualified:

The Pearson Correlation Coefficient for 4QC/(4QC+L+0.01) vs win percentage, normalized, is: 0.5487. This indicates that there is a moderate positive correlation between 4QC and win percentage. This relationship is statistically significant for p < 0.05.
The Coefficient of Determination is: 0.3011.
Here is a scatter plot so you can see the correlation visually:
.
.
————————————————————————————————————————————————
Determining the Weight of Blowout Wins
————————————————————————————————————————————————
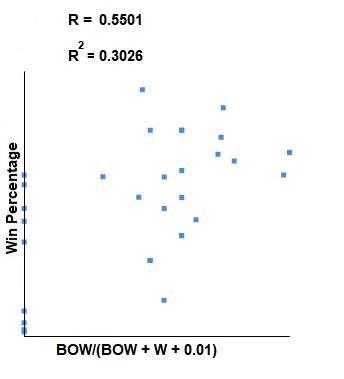
I needed a stat to help balance 4QCs, in the event that a QB never even had the opportunity for one. It made sense to me to include the opposite type of win: the blowout. The way I will be balancing blowouts is by dividing BOW by BOW + WINS + 0.01, for similar reasoning with 4QC. In this case, the number will never be higher than 0.499, which rounds to 0.500. And that helps balance the fact that blowouts may have more to do with the team than the QB, which, working hand in hand with the additional 0.25 weight this stat will receive, works out well. The QB gets some credit, but it is recognized that blowouts are a team effort.
All that said, here is the BOW/W data for the 31 quarterbacks who qualified:

The Pearson Correlation Coefficient for BOW/L vs win percentage, normalized, is: 0.5501. This indicates that there is a strong positive correlation between 1D% and win percentage. This relationship is statistically significant for p < 0.05.
The Coefficient of Determination is: 0.3026.
Here is a scatter plot so you can see the correlation visually:
.
.
————————————————————————————————————————————————
Determining the Weight of First Down Passing Percentage
————————————————————————————————————————————————
Moving the chains is crucial to winning games, so it would be criminal not to include this statistic in a quarterback rating system. I will be using the definition of this statistic given by Pro Football Reference, which is simply, first downs per pass play (and a pass play is pass attempts + sacks).
That said, here is the 1D% data for the 31 quarterbacks who qualified:

The Pearson Correlation Coefficient for 1D% vs win percentage, normalized, is: 0.8605. This indicates that there is a strong positive correlation between 1D% and win percentage. This relationship is statistically significant for p < 0.05.
The Coefficient of Determination is: 0.7404.
Here is a scatter plot so you can see the correlation visually:
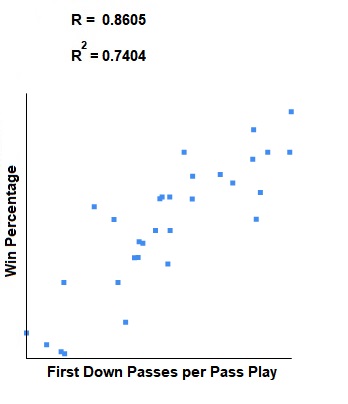
Given the strong correlation with winning for 1D%, that statistic will be weighted the heaviest in this quarterback rating formula.
.
.
————————————————————————————————————————————————
————————————————————————————————————————————————
SACKS STATISTICS:
————————————————————————————————————————————————
————————————————————————————————————————————————
First, it should be noted that I am not blaming QBs entirely for sacks. However, it varies from play to play, so I will simply have to make a judgement call on this based on my intuition. What I'm choosing to go with is that a QB is responsible for one fourth of all sacks. Half the blame is given to the line, one fourth to WRs not getting open or running the wrong route, and one fourth to QBs not making the right read or choice.
.
.
————————————————————————————————————————————————
Determining the Weight of Sacks per Game
————————————————————————————————————————————————
Here is the S/G data for the 31 quarterbacks who qualified.

The Pearson Correlation Coefficient for this data vs win percentage, normalized, is: -0.4612 This indicates that there is a weak negative correlation between rushing yards per game and win percentage. This relationship is statistically significant for p < 0.05.
The Coefficient of Determination is: 0.2127.
Here is a scatter plot so you can see the correlation visually:
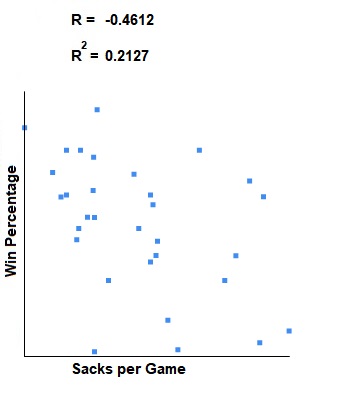
Now, this result is extremely interesting. Remember Colin Kaepernick in 2016? He only threw 4 interceptions, and his interception rate was extremely low (0.364 INT/G). But his sack rate was pretty high, at 3.27, which would have put him near the bottom of this years' data. And incidentally, he did not win that many games. I take that as a single point of confirmation evidence that this should be taken into account. QBs are not solely responsible for sacks, but they share part of the blame.
.
.
————————————————————————————————————————————————
Determining the Weight of Sack Yards Lost per Game
————————————————————————————————————————————————
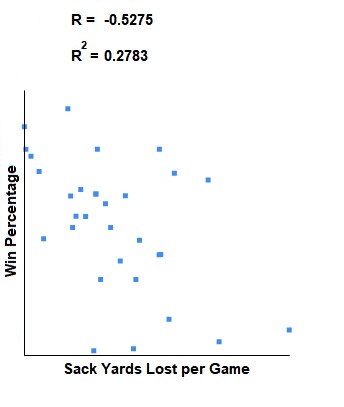
Here is the SYL/G data for the 31 quarterbacks who qualified.

The Pearson Correlation Coefficient for this data vs win percentage, normalized, is: -0.5275. This indicates that there is a weak negative correlation between rushing yards per game and win percentage. This relationship is statistically significant for p < 0.05.
The Coefficient of Determination is: 0.2783.
Here is a scatter plot so you can see the correlation visually:
.
.
————————————————————————————————————————————————
————————————————————————————————————————————————
FUMBLE STATISTICS:
————————————————————————————————————————————————
————————————————————————————————————————————————
The only note here is that I'm not distinguishing between fumbles recovered or not recovered. Neither is good, and whether or not it's recovered has nothing to do with the QB.
.
.
————————————————————————————————————————————————
Determining the Weight of Fumbles per Game
————————————————————————————————————————————————
Here is the F/G data for the 31 quarterbacks who qualified.

The Pearson Correlation Coefficient for this data vs win percentage, normalized, is: -0.2295. This indicates that there is a weak negative correlation between rushing yards per game and win percentage. This relationship is statistically significant for p < 0.05.
The Coefficient of Determination is: 0.05265.
Here is a scatter plot so you can see the correlation visually:

[ Edited by 5_Golden_Rings on Sep 16, 2022 at 6:49 AM ]


