There are 345 users in the forums

New homegrown QB rating metric. Jimmy "controversially" ranks 12th...

Shop 49ers game tickets
Originally posted by SanDiego49er:
That's roughly fair. But he wins better than #12 overall. Even #12 overall is much better than he is thought of here on the WZ. He's definitely better than 20 out of 32 QB'S when healthy. Probably a little better than that even. 2 NFC Championship games and 1 Super Bowl in 3 years is outstanding. He's not anywhere near as bad as he's portrayed here.

Yeah, he probably wins better than 12th overall, but then again, QBs aren't the only thing that goes into winning. He's also been on a really good team.

In fact, that's the biggest issue with this metric, is that team contribution leaks in. You can see that by the Stafford 2020 comparison. In one season in this metric he went from just under Jimmy to just under Brady in 2021 (it should be noted that Stafford's 2020 rating still indicates a winning QB, given that the QBs around that number had winning records, so he was still playing winning football, but just on a terrible team). The degree to which a good team helps a QB, by the way, goes beyond simple passing stats. For example, QB on a good team doesn't have to take as many chances.

Fortunately, since I used Excel for this, I can very easily strictly look at things in which the QB has 99% control over (simply rushing and passing stats, all weighted by win correlation).

When I do that, Josh Allen bulldozes to the top, Rodgers jumps to 2nd, Russell Wilson skyrockets—prancing along the way—to number 5, Murray leaps to 7, Brady falls to 8, and Jimmy falls to 15th. Also, Zach Wilson is no longer the worst QB. If I include all pass stats, all rush stats, on target passing, sacks and fumbles, Jimmy remains at 15. He doesn't jump back up to 12 unless I use 1D%. And that does depend on the QB, but a first down pass is a first down pass whether it's a 30 yard bomb or a screen pass.

And therein lies the biggest weakness in this metric as it is right now: the most important stat there is doesn't distinguish between who does the work. That's why I've been contemplating removing it, unless I can get a completed air yards version of it. I've been trying to think of a way to tie CAY to it.

Maybe I'll do something like yards per attempt, but make on target passes the attempts. "Completed Air Yards Per On Target Pass." However, this isn't good enough, because (1) it could just mean that WHEN someone is on target, they get lots of yards, and (2) it has a weak correlation with winning (which makes sense given (1)). But, perhaps what I can do is multiply that number by first downs per pass attempt. The units would be weird: [Y][1ST]/([ATT][PASS PLAY]). But, I can fix that by using first downs per pass rather than first downs per pass attempt (which makes sense, because I'm already taking sacks into account directly). So it would be (Completed Air Yards per On Target Pass) * (First Downs per Pass Attempt). This actually correlates about as much as CAY, so it's small, but not weak.

And IF I do that, and scale/translate it so that the top rating is again about 112 (which means 34 and 120 instead of 30 and 120, because the above stat is weaker than 1D%—this scaling adjustment raises the top score by 0.98, so it's basically the same), we get Jimmy as ranking as still ranking 12, but his rating drops about 1.94 points. The mean drops by 1.73, so Jimmy does actually get a tiny bit worse if we're more focused on HIS contributions to 1D% (on average) than just the raw 1D% numbers.

This is, admittedly, a band aid to the problem, but I think (CAT/OnTgt)*(1D/ATT) is a better barometer for QB performance than 1D% alone. And to me, that's just a stronger argument that Jimmy is about the 12th best QB.

.
.
ONE ADDITIONAL CONSIDERATION: I'm taking into account first down passing, but not first down rushing. I think I'll add that on my next modification. Blocking certainly matters for rushing, but it's harder to delete that out, so I'll probably just go with Rushing 1D%. Or, perhaps I'll try to incorporate something using rushing attempts per broken tackle into it (Att/Br. Lower is better) and yards after contact (RYAC. Higher is better.). Might end up redoing the rushing contribution entirely, focusing on 1D, RYAC, Att/Br (or maybe, Br/Att, in which case higher would be better), and rushing TDs.
Thinking a little more about this, the problem with CAY/OnTgt*1D/ATT. Namely, since this is multiplication and division, with no addition or subtraction, you can swap the denominators without changing the number. Doing so, you have CAY/ATT * 1D/OnTgt. That second fraction is what worries me. If you only throw a few first downs, but are extremely inaccurate, that number will be very large. That is a problem! Maybe that's why the correlation is only about the same as CAY.

A better solution may be this: CAY * OnTgt% (OnTgt% is on target passes minus spikes and throwaways), and a separate term, (CAY/ATT) * 1D.

What units are those in? Assuming OnTgt is in units of attempts, then the first number comes out in yards. For the second, we end up with units of Yards*First Downs per attempt. That's not that weird. You could just call it first down yards per attempt, as long as you understand that it is relation to the pass travel distance, not the distance to the marker. It is NOT yards PER first down per attempt. That would mean 1D should be in the denominator. So, physically speaking, it's not particularly intuitive. But in my formula, I modify all the coefficients so that each term is unitless anyway.

Why scale 1D and OnTgt% by CAY? Because there has to be a way to take into account how far the pass is being thrown, because it's simply a fact that 3rd and 20 is harder to convert than 3rd and 1, and that a thirty yard pass is harder to be accurate on than a three yard pass. Otherwise, it's more of a team stat than a quarterback stat. Neither one of these is going to correlate as much with wins as their unmodified version, I suspect, because, as is often said here, winning is a team stat. But,QBs still contribute more than other positions, so combined, the two shouldn't be that far away from either alone.

So, how do these stats correlate with win percentage?

The first one, CAY * OnTgt%, has a correlation coefficient of 0.4078 and a coefficient of determination of 0.1663. This is a weak positive correlation. For comparison, OnTgt% alone had a correlation coefficient of 0.4385 and a coefficient of determination of 0.1923. What that seems to tell me is that the QBs contribution to on target passing is less important than the whole team contribution, which makes sense to me. These numbers are on the order of magnitude of 1, so the adjustment coefficient must be 0.1,giving a final coefficient of 0.02.

The second one, (CAY/ATT)*1D%, unsurprisingly has a higher correlation coefficient, a value of 0.6766. It has a coefficient of determination of 0.4578. That is a moderate positive correlation. What this seems to say (in comparison to straight 1D%) is that while first down% correlates highly with winning, the QB's contribution to the total play is less than the whole, but still somewhere around half or more of importance to the play, which, again, makes sense. Like the previous stat, this one will have an adjustment coefficient of 0.1. Which gives a final coefficient of 0.05.

Once again, Jimmy remains at 12. I'm telling you, that's about where he ranks among these QBs. Mahomes and Herbert switch spots with this change. Rodgers holds steady at third.

HOWEVER, replacing 1D% with these two stats puts STAFFORD at the top. And I know what you're thinking. Isn't this Rings guy a Stafford fanboy? First of all, no, I'm not. I've always thought he was a good quarterback. But my arguments regarding Stafford here were simply because Jimmy fanboys claimed Jimmy was better than him, or at least as good—which is obviously wrong to me. There was literally no other reason I got involved in that discussion. Second, once again, this metric is based on WIN PERCENTAGE. And which QB just won the Super Bowl? I'd say that's a pretty good endorsement for this.

It's not my fault that Stafford (and Jimmy, incidentally) is good at moving the chains, nor is it my fault that doing so has a high correlation with winning. And, neither is it my fault that Stafford led the NFL in CAY/A (not a huge correlation with winning, but still pretty high), and nor is it my fault he threw 41 TDs (high correlation with winning), nor is it my fault that interceptions simply don't matter that much to winning (the thing he did worst at). It is what it is. Stafford is good at the things that contribute to winning—or at least he was in 2021.

I'm gonna rerun his stats from 2020 to see if anything changes. With these two things replacing 1D%, Stafford goes down a few points (from 94.618 to 90.366); still winning quarterbacking, but barely. 2007 Brady goes UP a couple of points, interestingly enough (from 153.671 to 155.340) . This also knocks 2018 Mahomes (from 128.998 to 118.871), 2020 Rodgers (from 121.636 to 112.318), and 2013 Manning (from 137.712 to 122.862) down quite a bit.

It's interesting that every one of these great seasons goes down with this adjustment, except Brady's 2007 season, which goes up. It shouldn't be that surprising. While Brady certainly had his share of dinks and dunks in 2007, that offense was also ridiculously explosive.

.
.
.
.

Now, I still have to redo rushing contribution, to something more useful than simply rushing yards and TDs. That should bring Allen up a bit higher, along with Jackson. Presently, rush statistics are not statistically significant. My hope is that by the end of this I'll weed out the statistically insignificant values (but obviously if there are no rushing stats that are significant, I'll be compelled to keep them anyway, because sometimes it matters in games, whether or not it's statistically significant).
man I thought I had a decent amount of time on my hands lol.... anywho good work.
Originally posted by DRCHOWDER:
man I thought I had a decent amount of time on my hands lol.... anywho good work.

My job has lots of down time in front of a desk waiting for a call.
Right, so I've thought about it, and here's how I'm going to do rushing:

Instead of rushing yards and TDs, it will be this:

(RYAC + BRK)/ATT R + RTD/ATT R + RD1/ATT

where
RYAC = rush yards after contact
BRK = broken tackles
RTD = touchdowns
R1D = rushing first downs
and ATT R = rushing attempts.

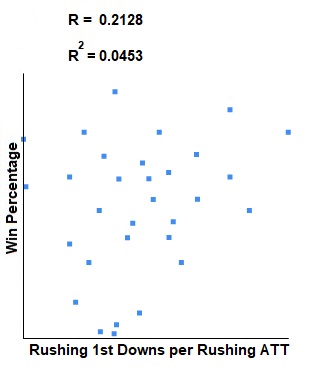
In addition, I will only consider QBs who rushed at least 6 times per game for the full award, because once again the overall correlation with win percentage is negative (and for those below 6 rushes per game, win% correlation was also negative). So, we'll again have a piecewise function. R1D/ATT, however, has a positive relationship, with a correlation of 0.2128. and a coefficient of determination of 0.0453.so everyone will get full credit for them.

Scatter plot:


For those with over 6 rushes per game, the correlation with attempts was 0.1928, and the Coefficient of Determination was 0.0372. The correlation with 5 or fewer attempts was -0.1368, with a coefficient of determination of 0.0187.

So, the way I will redo rushing yards is this:

ALL QBs will get a coefficient of determination bonus of 0.0453 for first downs rushing. And QBs who rushed for at least 6 times per game will get a coefficient of determination bonus for rush yards+break tackle stats equal to the distance between the two respective rush attempt coefficients of determination, which is sqrt([0.0372]^2 - [-0.0187]^2) = 0.0321. Those who did not rush for 6 rushes per game will get a bonus of 0.001, like before, instead of a penalty.

The adjustment coefficients will determined as follows:

Each individual stat will be multiplied by the Adjustment Coefficient, and then the total term will be multiplied by the Coefficient of Determination. So, the Adjustment Coefficients are:

RYAC:
Mean RYAC = 52.355
Mean R ATT = 53.097
=> RYAC/R ATT = 0.986

So, the Adjustment Coefficient will be 1.

BRK:
Mean BRK = 1.774
=> BRK/R ATT = 0.0334

So the Adjustment Coefficient will be 10.

TD:
The TD Adjustment Coefficient is already known to be 10, and the known final coefficient is 0.02.

R1D:
Mean R1D: 18.903
=> R1D/R ATT = 0.356

So the Adjustment Coefficient for R1D will be 1.

————————————————————————————————————————————————
New Rushing Adjustment Coefficients:
————————————————————————————————————————————————

Rushing Yards After Contact, Broken Tackles, and TDs:

For 6 attempts per game or more:
0.0321*(RYAC + 10*BRK)/ATT R

For fewer than 6 attempts per game:
0.001*(RYAC + 10*BRK)/ATT R

.

Rushing First Downs:
0.0453*R1D/ATT R

.
In addition to the already calculated 0.02* RTD/ATT R.
.
.
.
.
.
.
.

Making these changes—which puts more emphasis on what the QUARTERBACK does with rushing—along with the changes to on target passing and weighting 1D% passing by CAY/ATT, alters the WQBR ranking as follows:

First, the translation and scaling factors are 25 and 150, instead of 30 and 120, because doing this makes keeps the highest rating between 112 and 113.

Trey goes down to 100.644. Jimmy goes down to 91.607, but jumps up in rank to 11.

The new ranking, with changes to put more emphasis on advanced rushing stats, with the addition of On Target Passing (weighted by CAY), and 1D% weighted by CAY:


There are no major changes here, and I wouldn't expect too many. But this new version ought to be a little more accurate, because (1) it slightly reduces the team contribution to the most important stat to winning, 1D%; (2) it includes actual accuracy (via On Target Passing), which helps with YAC, although it is weighted by CAY—as it should, since short passes are easier to be accurate on; (3) it replaces rushing yards with rushing yards after contact, adds broken tackles, and adds rushing first downs, the latter of which has a positive correlation with WIN% (like before, small bonuses were given for rushing stats that actually have negative correlations for the sample of 31 QBs, because the truth is for a few QBs, rush stats are crucial to their game).

And with these changes, here is the new formula (btw, shame on you guys [and me] for forgetting the order of operations and not using parentheses in my first paste of the formula):


Now it's so big I had to make it two lines. But at least it's more legible this way. New stats include RYAC (rush yards after contact), BRK (broken tackles), 1DR (first downs rushing), OnTgt% (percentage of passes on target, not including spikes and throw aways), and now 1D is weighted by CAY/ATT. These changes help to reduce the leakage from team contributions into the rating.
[ Edited by 5_Golden_Rings on May 13, 2022 at 10:41 AM ]
I'll be honest, I quit giving a crap which QB falls where pretty early on in the first post, and became fascinated with the process of trying to develop a meaningful statistic. f**king outstanding thread.
Some stats that have a weak correlation with winning may be being overvalued here. The goal is to rank QBs, not teams. As such, I think I need to re-think how I'm doing fourth quarter comebacks and blowout wins. I think both of these need to be reduced in their weight. Why? Because for each QB they are so numerically small. The result is they are being overweighted.

I think maybe how I'll do this is to replace Losses and Wins in the denominator with games started. This should reduce the number somewhat, while still keeping things ranked about the same among the QBs in those statistics. It's a reduction of weight, but not a massive one. The coefficients will remain the same.

This should not anger Jimmy Club members though, because he's still one of the best in the NFL at the heaviest weighted stat: 1D passing.

.
.
.
Surprise, surprise, if I do that, Jimmy remains 12th. Josh Allen becomes 1, however, which is a little weird. Maybe it's because 4QC is somewhat devalued. Russell Wilson leapfrogs Jimmy, and I hate to say it, but that makes sense, regardless of his suckage at clutch situations this year. I think we all are in agreement he's better than Jimmy. But it's not by much with this adjustment. Wilson would be 90.6 with this change, and Jimmy 89.3. Allen would be at the top with 111.1, with Stafford at 2, followed by Brady, Rodgers and Herbert.

On the other hand, it doesn't make sense for 4QC to be divided by total games, because, again, not all QBs will have the same opportunities. I wish 4QC opportunities was an easily findable stat. So, what I'll do is make the above changes to blowout wins, because even losses are an opportunity to blow the opponent out, and switch 4QC back to what it originally was, 4QC/(4QC+L+0.01). In that case Jimmy stays at 11.
[ Edited by 5_Golden_Rings on May 17, 2022 at 12:59 PM ]
This is good stuff Golden. Good stuff.

This, like QBR or any other metric to judge QBs, should be taken the same way. Just another way to measure QBs. Every formula places different values on different things. When judging a QB, one should use ALL metrics to come to an opinion. This will be yet another metric to add to the list.

Are you planning on running this for all the QBs in the 2022 season? Or, if I had to guess, is that too time consuming that it wouldnt be something you could do on a weekly basis?
Originally posted by SteveWallacesHelmet:
This is good stuff Golden. Good stuff.

This, like QBR or any other metric to judge QBs, should be taken the same way. Just another way to measure QBs. Every formula places different values on different things. When judging a QB, one should use ALL metrics to come to an opinion. This will be yet another metric to add to the list.

Are you planning on running this for all the QBs in the 2022 season? Or, if I had to guess, is that too time consuming that it wouldnt be something you could do on a weekly basis?

I will if I get it where I want it to be.

And that means, I find any logical errors in it and fix them, and I get the right stats to consider. I'll know if I'm wrong on those if someone like Sam Darnold tops the list. Currently I'm trying to work out how much emphasis to give clutch scenarios. The primary problem is that, while they may be statistically significant, the sample sizes are very small. I think what I may end up doing is just taking the average number of conversions of these opportunities (it's about 4), dividing that by the total average number of starts, and using that as a coefficient to further reduce their weight. Because as it stands, it really hurts QBs that either (a) never get a 4QC opportunity, or (b) are on a terrible team.

EDIT: it's not THAT time consuming, because there's only one stat I'm using that I can't just take off of Pro Football Reference's rankings (blowout wins, which I chose to counterbalance 4QC because some guys never get a chance at them, and currently which the QB is given 0.25 of the credit, in addition to the adjustment and win correlation coefficients. Got to look at each game for this one). Basically all I have to do is go to PFR passing stats, grab my excel sheet, and manually enter what I see. It will probably be like an hour of work per week, I imagine.

I am, however, considering deleting that stat. It really is a team stat, and whatever arbitrary amount I decide to give QBs credit for is going to have accuracy that varies wildly.
[ Edited by 5_Golden_Rings on May 18, 2022 at 8:04 AM ]
Originally posted by 5_Golden_Rings:
Right, so I've thought about it, and here's how I'm going to do rushing:

Instead of rushing yards and TDs, it will be this:

(RYAC + BRK)/ATT R + RTD/ATT R + RD1/ATT

where
RYAC = rush yards after contact
BRK = broken tackles
RTD = touchdowns
R1D = rushing first downs
and ATT R = rushing attempts.

In addition, I will only consider QBs who rushed at least 6 times per game for the full award, because once again the overall correlation with win percentage is negative (and for those below 6 rushes per game, win% correlation was also negative). So, we'll again have a piecewise function. R1D/ATT, however, has a positive relationship, with a correlation of 0.2128. and a coefficient of determination of 0.0453.so everyone will get full credit for them.

Scatter plot:


For those with over 6 rushes per game, the correlation with attempts was 0.1928, and the Coefficient of Determination was 0.0372. The correlation with 5 or fewer attempts was -0.1368, with a coefficient of determination of 0.0187.

So, the way I will redo rushing yards is this:

ALL QBs will get a coefficient of determination bonus of 0.0453 for first downs rushing. And QBs who rushed for at least 6 times per game will get a coefficient of determination bonus for rush yards+break tackle stats equal to the distance between the two respective rush attempt coefficients of determination, which is sqrt([0.0372]^2 - [-0.0187]^2) = 0.0321. Those who did not rush for 6 rushes per game will get a bonus of 0.001, like before, instead of a penalty.

The adjustment coefficients will determined as follows:

Each individual stat will be multiplied by the Adjustment Coefficient, and then the total term will be multiplied by the Coefficient of Determination. So, the Adjustment Coefficients are:

RYAC:
Mean RYAC = 52.355
Mean R ATT = 53.097
=> RYAC/R ATT = 0.986

So, the Adjustment Coefficient will be 1.

BRK:
Mean BRK = 1.774
=> BRK/R ATT = 0.0334

So the Adjustment Coefficient will be 10.

TD:
The TD Adjustment Coefficient is already known to be 10, and the known final coefficient is 0.02.

R1D:
Mean R1D: 18.903
=> R1D/R ATT = 0.356

So the Adjustment Coefficient for R1D will be 1.

————————————————————————————————————————————————
New Rushing Adjustment Coefficients:
————————————————————————————————————————————————

Rushing Yards After Contact, Broken Tackles, and TDs:

For 6 attempts per game or more:
0.0321*(RYAC + 10*BRK)/ATT R

For fewer than 6 attempts per game:
0.001*(RYAC + 10*BRK)/ATT R

.

Rushing First Downs:
0.0453*R1D/ATT R

.
In addition to the already calculated 0.02* RTD/ATT R.
.
.
.
.
.
.
.

Making these changes—which puts more emphasis on what the QUARTERBACK does with rushing—along with the changes to on target passing and weighting 1D% passing by CAY/ATT, alters the WQBR ranking as follows:

First, the translation and scaling factors are 25 and 150, instead of 30 and 120, because doing this makes keeps the highest rating between 112 and 113.

Trey goes down to 100.644. Jimmy goes down to 91.607, but jumps up in rank to 11.

The new ranking, with changes to put more emphasis on advanced rushing stats, with the addition of On Target Passing (weighted by CAY), and 1D% weighted by CAY:


There are no major changes here, and I wouldn't expect too many. But this new version ought to be a little more accurate, because (1) it slightly reduces the team contribution to the most important stat to winning, 1D%; (2) it includes actual accuracy (via On Target Passing), which helps with YAC, although it is weighted by CAY—as it should, since short passes are easier to be accurate on; (3) it replaces rushing yards with rushing yards after contact, adds broken tackles, and adds rushing first downs, the latter of which has a positive correlation with WIN% (like before, small bonuses were given for rushing stats that actually have negative correlations for the sample of 31 QBs, because the truth is for a few QBs, rush stats are crucial to their game).

And with these changes, here is the new formula (btw, shame on you guys [and me] for forgetting the order of operations and not using parentheses in my first paste of the formula):


Now it's so big I had to make it two lines. But at least it's more legible this way. New stats include RYAC (rush yards after contact), BRK (broken tackles), 1DR (first downs rushing), OnTgt% (percentage of passes on target, not including spikes and throw aways), and now 1D is weighted by CAY/ATT. These changes help to reduce the leakage from team contributions into the rating.

Yeah, I'd like to see Breida when he was with us VS Eli Mitchell.

I thought Mitchell was MEH at best but everyone was gassing him.
Originally posted by TonyStarks:
Originally posted by 5_Golden_Rings:
Right, so I've thought about it, and here's how I'm going to do rushing:

Instead of rushing yards and TDs, it will be this:

(RYAC + BRK)/ATT R + RTD/ATT R + RD1/ATT

where
RYAC = rush yards after contact
BRK = broken tackles
RTD = touchdowns
R1D = rushing first downs
and ATT R = rushing attempts.

In addition, I will only consider QBs who rushed at least 6 times per game for the full award, because once again the overall correlation with win percentage is negative (and for those below 6 rushes per game, win% correlation was also negative). So, we'll again have a piecewise function. R1D/ATT, however, has a positive relationship, with a correlation of 0.2128. and a coefficient of determination of 0.0453.so everyone will get full credit for them.

Scatter plot:


For those with over 6 rushes per game, the correlation with attempts was 0.1928, and the Coefficient of Determination was 0.0372. The correlation with 5 or fewer attempts was -0.1368, with a coefficient of determination of 0.0187.

So, the way I will redo rushing yards is this:

ALL QBs will get a coefficient of determination bonus of 0.0453 for first downs rushing. And QBs who rushed for at least 6 times per game will get a coefficient of determination bonus for rush yards+break tackle stats equal to the distance between the two respective rush attempt coefficients of determination, which is sqrt([0.0372]^2 - [-0.0187]^2) = 0.0321. Those who did not rush for 6 rushes per game will get a bonus of 0.001, like before, instead of a penalty.

The adjustment coefficients will determined as follows:

Each individual stat will be multiplied by the Adjustment Coefficient, and then the total term will be multiplied by the Coefficient of Determination. So, the Adjustment Coefficients are:

RYAC:
Mean RYAC = 52.355
Mean R ATT = 53.097
=> RYAC/R ATT = 0.986

So, the Adjustment Coefficient will be 1.

BRK:
Mean BRK = 1.774
=> BRK/R ATT = 0.0334

So the Adjustment Coefficient will be 10.

TD:
The TD Adjustment Coefficient is already known to be 10, and the known final coefficient is 0.02.

R1D:
Mean R1D: 18.903
=> R1D/R ATT = 0.356

So the Adjustment Coefficient for R1D will be 1.

————————————————————————————————————————————————
New Rushing Adjustment Coefficients:
————————————————————————————————————————————————

Rushing Yards After Contact, Broken Tackles, and TDs:

For 6 attempts per game or more:
0.0321*(RYAC + 10*BRK)/ATT R

For fewer than 6 attempts per game:
0.001*(RYAC + 10*BRK)/ATT R

.

Rushing First Downs:
0.0453*R1D/ATT R

.
In addition to the already calculated 0.02* RTD/ATT R.
.
.
.
.
.
.
.

Making these changes—which puts more emphasis on what the QUARTERBACK does with rushing—along with the changes to on target passing and weighting 1D% passing by CAY/ATT, alters the WQBR ranking as follows:

First, the translation and scaling factors are 25 and 150, instead of 30 and 120, because doing this makes keeps the highest rating between 112 and 113.

Trey goes down to 100.644. Jimmy goes down to 91.607, but jumps up in rank to 11.

The new ranking, with changes to put more emphasis on advanced rushing stats, with the addition of On Target Passing (weighted by CAY), and 1D% weighted by CAY:


There are no major changes here, and I wouldn't expect too many. But this new version ought to be a little more accurate, because (1) it slightly reduces the team contribution to the most important stat to winning, 1D%; (2) it includes actual accuracy (via On Target Passing), which helps with YAC, although it is weighted by CAY—as it should, since short passes are easier to be accurate on; (3) it replaces rushing yards with rushing yards after contact, adds broken tackles, and adds rushing first downs, the latter of which has a positive correlation with WIN% (like before, small bonuses were given for rushing stats that actually have negative correlations for the sample of 31 QBs, because the truth is for a few QBs, rush stats are crucial to their game).

And with these changes, here is the new formula (btw, shame on you guys [and me] for forgetting the order of operations and not using parentheses in my first paste of the formula):


Now it's so big I had to make it two lines. But at least it's more legible this way. New stats include RYAC (rush yards after contact), BRK (broken tackles), 1DR (first downs rushing), OnTgt% (percentage of passes on target, not including spikes and throw aways), and now 1D is weighted by CAY/ATT. These changes help to reduce the leakage from team contributions into the rating.

Yeah, I'd like to see Breida when he was with us VS Eli Mitchell.

I thought Mitchell was MEH at best but everyone was gassing him.

Hole up mang. The poor rush yards correlation is with QUARTERBACKS. I strongly suspect RUNNING BACK rush yards has a positive correlation with winning.

In fact, since I have down time at work, Imma check it out.

.
.
.

Yep, there is a positive correlation between rushing yards for a rb and the team's win%. However, I didn't look at the win% of the running backs. Just their teams (due to laziness). And only the rbs who started 10 or more games. Moreover, the correlation is weak. But it IS positive. R = 0.1548.
You should show this to the Panthers and the Giants.
You forgot to carry the one.
Updated this a bit. Reasons are in OP.

According to the new formula, Trey did god awful in week one, with a rating of 55.729, lower than the worst QB in the league last year (per the updated formula). HOWEVER, it should be noted that this formula is problematic for only one game at this time, due to its reliance on fourth quarter comebacks and blowout wins as a percentage of wins or losses. That said, had he thrown just one TD, his rating would have went up nearly 30 points, clear to 82.514—and he missed that by mere yards.

But he was only on target for 63% of his passes (per PFR), which, had this been 2021, would have ranked well beyond last place, behind the likes of Cam Newton and Blaine Gabbert. His CAY would have been middle of the pack, but his TD% was zero and his INT% would have been second last in the NFL.

It was just statistically terrible, extenuating circumstances aside. This metric doesn't account for weather or terrible pass protection, other than reducing the amount the QB gets blamed for sacks. And it won't until I find easily accessible stats or a simple way to do so.

New formula:

And last year's rankings with these adjustments:
Any system that gives more credence to 4th quarter performance isn't gonna do any favors to a guy who plays the 4th quarter in monsoon.
Share 49ersWebzone